
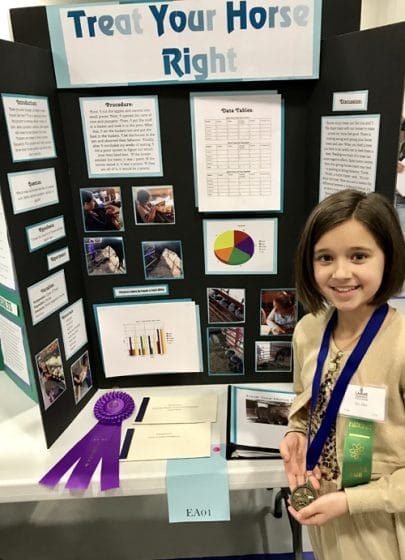
Ten-year-old Ava Alley, a 4th grade student at Walsh Elementary in Walsh, Colorado, decided to enter her school’s science fair for the first time. She chose her project because of her love of horses. Knowing horses like carrots and apples, Ava wondered if horses would like corn, pumpkin, or dates even more.
In her research Ava asked the question, “Which treat do horses like best of canned corn, dates, canned pumpkin, carrots, or apples?”
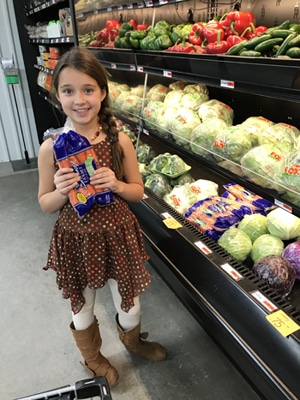
Shopping for horse treats.
Ava’s hypothesis for her experiment was:
I think the majority of the horses will like the apples best.
Science Talk—hypothesis: a possible explanation for an observation, situation, or scientific problem that can be tested by further investigation.
Procedures
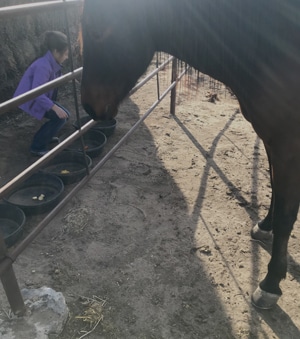
First Ava cut the apples and carrots into small pieces. Next, she opened cans of corn and pumpkin. She put the treats in a basket and took the treats to the pens. Ava placed buckets outside the fence, one for each food type, and put the treats in the buckets.
One at a time she let the horses in the pen. Each treat was offered one at a time by pushing a bucket under the fence. Ava watched and recorded what the horse did.
Each week Ava changed the order in which the treats were offered. Her thinking was that the horses wouldn’t know the order of the treats. They’d have to smell and taste each treat. She thought it would help determine which treat they really liked best.
Ava recorded her observations using a table to collect her data and displayed the results with graphs.
 The horses Ava used in her experiment were:
- Horse 1: Deef, a bay horse belonging to Ava’s father.
- Horse 2: Divot, a sorrel horse that Ava’s cousin rides at their ranch.
- Horse 3: Rooster, a black horse belonging to Ava’s sister.
- Horse 4: Sparky, Ava’s sorrel horse
Over the four weeks of testing Ava used a point system to figure out which treat the horses liked best.
- If the horses smelled the treats, it was 1 point.
- If the horses tasted it, it was 2 points.
- If they ate all of it, they scored 3 points.
What’s your hypothesis? Do you agree with Ava’s? Which treat do you think the horses liked the best? Let’s take a look at Ava’s findings.
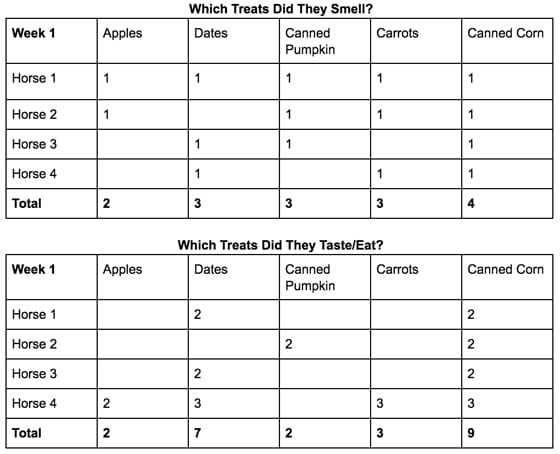
The first week Ava offered the canned corn first, followed by apples, dates, canned pumpkin, and carrots.
Here’s the data Ava collected in the first week of her experiment:
Here’s a graph displaying week one results:
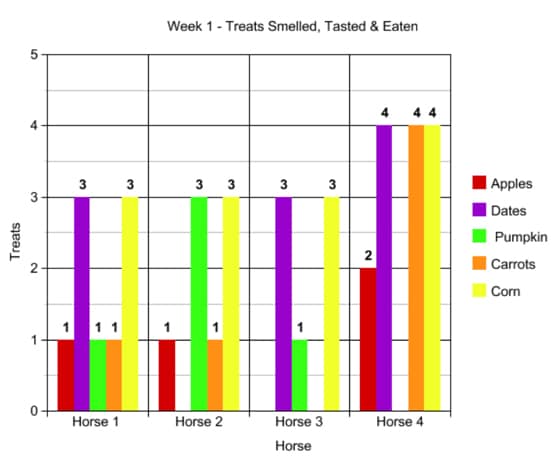
1) What kind of graph did Ava use to display her data?
2) Which treat did the horses like the best?
3) Which treat was the least favourite?
In the second week the treats were fed in the following order: carrots, canned corn, apples, dates and canned pumpkin.
Here’s the graph showing Ava’s observations for week 2:
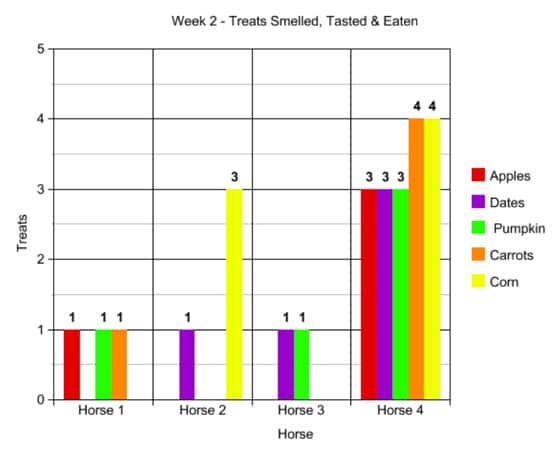
4) Did Deef (horse 1) eat any of the treats?
5) Sparky (horse 4) scored two fours in his section of the graph. What does this tell you about how Sparky interacted with the carrots and corn?
6) Divot (horse 2) received a ‘3’ for corn. What does this tell you about how Divot interacted with the corn?
In the third week the treats were fed in the following order: Canned pumpkin, carrots, canned corn, apples, and dates.
In the fourth week the treats were offered in this order: Canned pumpkin, dates, carrots, canned corn, and apples.
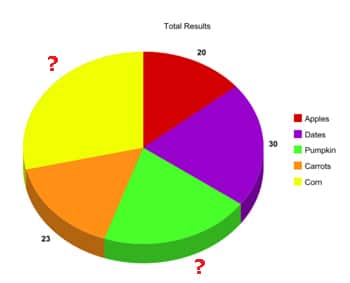
Ava decided a pie chart (circle graph) would be the best way to display the totals. A total of one hundred forty-three points was scored over the course of her four week experiment.
7) Pumpkin scored six more points than carrots. How many points did pumpkin score?
8) How many points did corn receive over the entire four weeks?
 Conclusions:
Ava concluded that her hypothesis was incorrect because the majority of the horses liked the corn better.
She thought about why that might be; the horses might have liked the corn more because corn is in sweet feed and other things so they’re used to it.
She also observed the horses started liking all of the foods but still had a favourite.
Horses don’t really like apples as much as people think. In horse movies, they use apples often for treats but horses Ava found they didn’t like them as much as other foods.
Ava wants to follow up on her research.
“Once their favorite treat has been discovered, then something I can test is to see if they will work for a treat.”
Application:
This project will help horse trainers know what treats horses like best.
Thank you Ava, for sharing your project with Horse Lover’s Math!

1) What kind of graph did Ava use to display her data?
Answer: Ava used a vertical bar graph to display her data.
2) Which treat did the horses like the best?
Answer: Canned corn.
3) Which treat was the least favourite?
Answer: Apples
4) Did Deef (horse 1) eat any of the treats?
Answer: No. He only smelled the apples, pumpkin and carrots.
5) Sparky (horse 4) scored two fours in his section of the graph. What does this tell you about how Sparky interacted with the carrots and corn?
Answer: Sparky smelled both the carrots and corn and ate all of each of the treats.
6) Divot (horse 2) received a ‘3’ for corn. What does this tell you about how Divot interacted with the corn?
Answer: This could mean two things. One, that Divot ate all of the corn. It could also mean that he smelled the corn and tasted it.
7) Pumpkin scored six more points than carrots. How many points did pumpkin score?
Answer: 23 + 6 = 29. Pumpkin scored 29 points.
8) How many points did corn receive over the entire four weeks?
Answer: 143 − (20 + 30 + 29 + 23) = 143 − 102 = 41. Corn received a total of 41 points during the four week experiment.


Here’s a link to an article about a current research project that asks the question, “Do pregnant mares have cravings like pregnant women?” Cierra Crowell is conducting a gestational palatability project, looking at the eating habits and preferences of five gestating mares compared to five nongestating mares. The study will examine how the horses respond to various foods over the length of their pregnancy, with the goal of understanding more about pregnant mares’ eating patterns https://buff.ly/2HmY15p
Merci pour les informations
i love horses