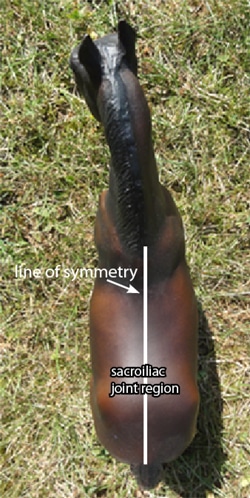
When you tack up a horse for a riding lesson, or go for a trail ride, does each horse have their own saddle? Like shoes are for us, if a saddle doesn’t fit, it can cause a horse discomfort.
Poorly fitted saddles cause back muscle asymmetry, an unnatural gait, and back pain for the horse. They can also cause back pain for the rider. To find out more about the horse, rider, and saddle relationship, researchers are studying saddle fit. They’re also looking at the shape of the horse’s back, and horse and rider health.

1. Now that you know what symmetry means, what do you think back muscle asymmetry means?
A recent study was conducted by Dr. Sue Dyson, head of clinical orthopaedics at the Animal Health Trust (AHT) Centre for Equine Studies, in Newmarket, England, and Line Greve, a PhD student at the AHT. The research was supported by World Horse Welfare (WHW).
Up until recently there has been little objective exploration of the horse-saddle-rider interaction. In particular, there was little work on the potential consequences of a saddle not fitting the horse, or the saddle not allowing the rider to sit in a position in which they can ride in balance.
Science Talk – objective: Basing your conclusions on facts rather than feelings and opinions when trying to find the truth about something.

The team assessed horses’ back asymmetries and observed any lameness present, and evaluated saddle slip, fit, and management, as well as rider straightness, from both the clinical examination and questionnaire responses.
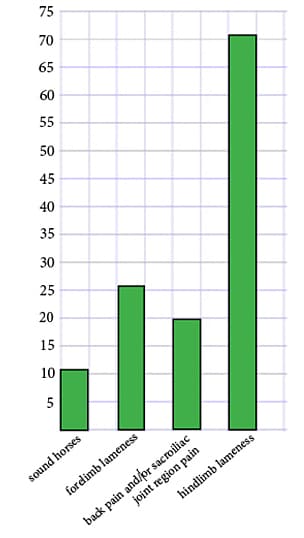
The graph to the left shows the study’s results.
2. What is this kind of graph called?
3. What does each square on the graph represent?
Now, let’s take a look at what the researchers found.
4. How many horses showed forelimb lameness?
5. How many horses exhibited hindlimb lameness?

6. How many of the horses with hindlimb lameness also had saddle slip?
7. How many horses were in the study all together?
Remember—at the start of the study all the owners thought their horse’s were sound!
The researchers identified ill-fitting saddles in 43% of horses during the first phase of the study when the researchers evaluated the saddles themselves.
8. Of the total number of horses, how many had ill-fitting saddles?
The study results strongly suggest that saddle fit should be checked regularly, and that riders and trainers should be encouraged to learn how to identify ill-fitting saddles. In addition, the study highlights the importance of being able to recognize lameness, saddle slip, and rider crookedness.
“It can only be of benefit for riders, trainers and other associated professionals to become more educated about the complexity of the links between lameness, saddle slip, ill-fitting saddles, and rider crookedness,” said Greve.
So, the next time you’re at the barn see if you can spot any horse’s with saddles that have slipped slightly to the side and riders whose bodies are not symmetrical when they’re riding. The more you learn about properly fitting a saddle, the better it will be for you and your horse.
Would you like to read more about this study? Click here.
How Important is a Properly Fitted Saddle?
1. Now that you know what symmetry means, what do you think back muscle asymmetry means?
Answer: It means muscles on one side of a horse will not be equal to the muscles on the other side so one side will be stronger than the other resulting in unbalanced movement.
2. What is this kind of graph called?
Answer: This type of graph is a vertical bar graph.
3. What does each square on the graph represent?
Answer: In this graph, one square represents 5 horses. This is called the scale.
4. How many horses showed forelimb lameness?
Answer: Twenty-six horses showed forelimb lameness.
5. How many horses exhibited hindlimb lameness?
Answer: Seventy-one horses exhibited hindlimb lameness.
6. How many of the horses with hindlimb lameness also had saddle slip?
Answer: 71 x .54 = 38.34. Thirty-eight horses also had saddle slip.
7. How many horses were in the study all together?
Answer: 11 + 26 + 20 + 71 = 128. One hundred and twenty-eight horses were in the study.
8. Of the total number of horses, how many had ill-fitting saddles?
Answer: 128 x .43 = 55.04. Fifty-five of the horses had poorly fitted saddles.
Common Core:
3.MD.B.3 – Interpret bar graphs
4.MD.B Represent and interpret data.
4.G.A.3 Recognize a line of symmetry for a two-dimensional figure as a line across the figure such that the figure can be folded along the line into matching parts.
5.NBT.B.7 – Multiply a decimal by a multi-digit whole number; Multiply decimals and whole numbers: word problems
6.RP.A.3c Find a percent of a quantity as a rate per 100
Photos:
Tack by John Shortland; CC BY 2.0
Horse and rider approaching King’s Copse Inclosure, New Forest by Jim Champion; CC BY-SA 2.0


That’s good to know that an ill-fitting saddle would be bad for the horse. I would think that it would be good to learn to look for a good saddle so that you could make it more comfortable for your horse. I’ll have to make sure that I get a good fitting one if I decide to get a horse in the future.
Loved those horses and I am very happy that I found your article very interesting to read. Thanks for the post.